Contract Us : 01844-532211, 01844-532213, 01844-532208   E-mail : info@crislbd.com

× Long Live the King Long Live the Queen

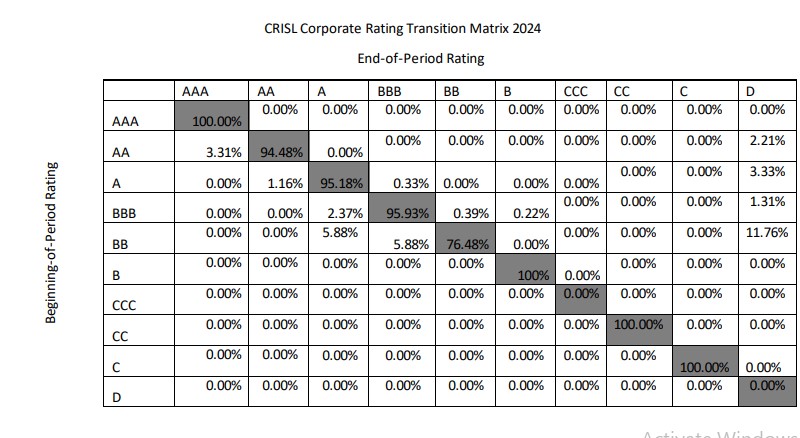
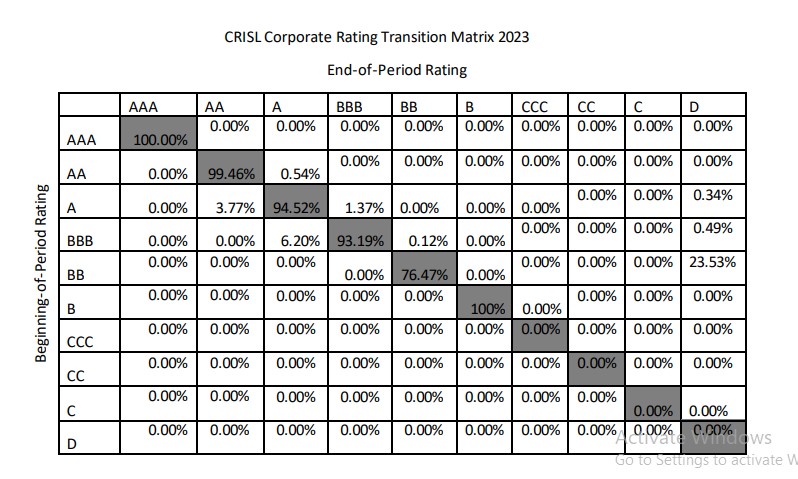
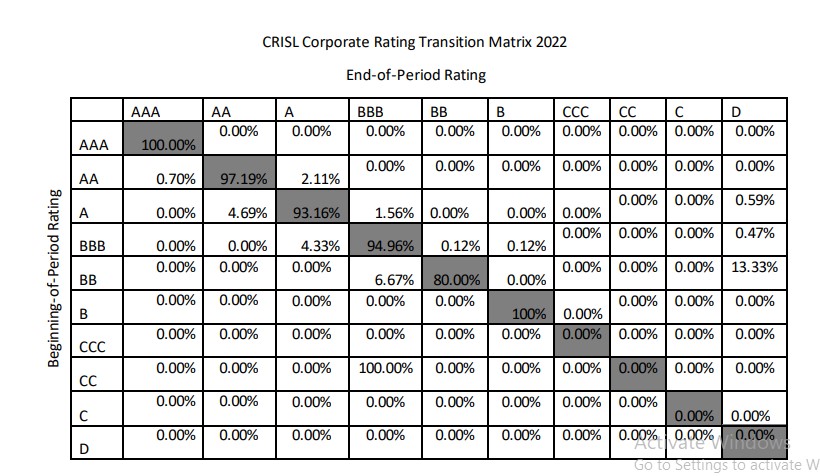
Transition Matrix - Corporate

Transition Metric shows the percentage of rating changes to total rated entities for a particular time period. The transition of ratings may be upwards or downwards in the scale. For example an A rated Bond,  over a period of time, might be downgraded to next lower scale BBB or upgraded to AA in view of change in forecasted fundamentals and other prevailing market factors.  Transition Metrics are helpful for managing credit risks, structuring and pricing of debt. These rates also indicate the accuracy (or inaccuracy) of rating agencies in forecasting the probability of default. 

CRISL Corporate Rating Transition Matrix (2014-2019)

         
  AAA AA A BBB BB B CCC CC C D
AAA 100.00% 0.00% 0.00% 0.00% 0.00% 0.00% 0.00% 0.00% 0.00% 0.00%
AA 7.58% 84.85% 7.57% 0.00% 0.00% 0.00% 0.00% 0.00% 0.00% 0.00%
A  0.00% 14.77% 81.82% 2.65% 0.38% 0.00% 0.38% 0.00% 0.00% 0.00%
BBB  0.00% 0.33% 18.33% 76.67% 4.34% 0.33% 0.00% 0.00% 0.00% 0.00%
BB 0.00% 0.00% 0.00% 9.09% 81.82% 9.09% 0.00% 0.00% 0.00% 0.00%
B 0.00% 0.00% 0.00% 0.00% 0.00% 50.00% 50.00% 0.00% 0.00% 0.00%
CCC 0.00% 0.00% 0.00% 0.00% 0.00% 0.00% 0.00% 0.00% 0.00% 0.00%
CC 0.00% 0.00% 0.00% 0.00% 0.00% 0.00% 0.00% 0.00% 0.00% 0.00%
C 0.00% 0.00% 0.00% 0.00% 0.00% 0.00% 0.00% 0.00% 100.00% 0.00%
D 0.00% 0.00% 0.00% 0.00% 0.00% 0.00% 0.00% 0.00% 0.00% 0.00%


  CRISL Corporate Rating Transition Matrix (2016-2020)


AAA

AA

A

BBB

BB

B

CCC

CC

C

D

AAA

100%

0.00%

0.00%

0.00%

0.00%

0.00%

0.00%

0.00%

0.00%

0.00%

AA

0.00%

91.86%

8.14%

0.00%

0.00%

0.00%

0.00%

0.00%

0.00%

0.00%

A

0.00%

8.98%

86.53%

4.19%

0.30%

0.00%

0.00%

0.00%

0.00%

0.00%

BBB

0.00%

0.00%

12.93%

85.36%

1.71%

0.00%

0.00%

0.00%

0.00%

0.00%

BB

0.00%

0.00%

0.00%

14.29%

80.95%

0.00%

4.76%

0.00%

0.00%

0.00%

B

0.00%

0.00%

0.00%

0.00%

0.00%

80%

20.00%

0.00%

0.00%

0.00%

CCC

0.00%

0.00%

0.00%

0.00%

0.00%

0.00%

0.00%

0.00%

0.00%

0.00%

CC

0.00%

0.00%

0.00%

0.00%

0.00%

0.00%

0.00%

0.00%

0.00%

0.00%

C

0.00%

0.00%

0.00%

0.00%

0.00%

0.00%

0.00%

0.00%

0.00%

0.00%

D

0.00%

0.00%

0.00%

0.00%

0.00%

0.00%

0.00%

0.00%

0.00%

100.00%


  CRISL Corporate Rating Transition Matrix (2016-2021)


AAA

AA

A

BBB

BB

B

CCC

CC

C

D

AAA

100%

0.00%

0.00%

0.00%

0.00%

0.00%

0.00%

0.00%

0.00%

0.00%

AA

0.00%

91.86%

6.98%

1.16%

0.00%

0.00%

0.00%

0.00%

0.00%

0.00%

A

0.00%

11.38%

82.63%

5.09%

0.90%

0.00%

0.00%

0.00%

0.00%

0.00%

BBB

0.00%

0.00%

15.78%

81.75%

2.28%

0.19%

0.00%

0.00%

0.00%

0.00%

BB

0.00%

0.00%

0.00%

19.05%

76.19%

0.00%

4.76%

0.00%

0.00%

0.00%

B

0.00%

0.00%

0.00%

0.00%

0.00%

80%

20.00%

0.00%

0.00%

0.00%

CCC

0.00%

0.00%

0.00%

0.00%

0.00%

0.00%

0.00%

0.00%

0.00%

0.00%

CC

0.00%

0.00%

0.00%

0.00%

0.00%

0.00%

0.00%

0.00%

0.00%

0.00%

C

0.00%

0.00%

0.00%

0.00%

0.00%

0.00%

0.00%

0.00%

0.00%

0.00%

D

0.00%

0.00%

0.00%

0.00%

0.00%

0.00%

0.00%

0.00%

0.00%

100.00%


  CRISL Corporate Rating Transition Matrix (2016-2022)


AAA

AA

A

BBB

BB

B

CCC

CC

C

D

AAA

100%

0.00%

0.00%

0.00%

0.00%

0.00%

0.00%

0.00%

0.00%

0.00%

AA

2.33%

91.86%

4.65%

1.16%

0.00%

0.00%

0.00%

0.00%

0.00%

0.00%

A

0.00%

14.07%

79.94%

4.49%

1.50%

0.00%

0.00%

0.00%

0.00%

0.00%

BBB

0.00%

0.00%

17.49%

79.85%

2.28%

0.38%

0.00%

0.00%

0.00%

0.00%

BB

0.00%

0.00%

0.00%

19.05%

76.19%

0.00%

4.76%

0.00%

0.00%

0.00%

B

0.00%

0.00%

0.00%

0.00%

0.00%

80%

20.00%

0.00%

0.00%

0.00%

CCC

0.00%

0.00%

0.00%

0.00%

0.00%

0.00%

0.00%

0.00%

0.00%

0.00%

CC

0.00%

0.00%

0.00%

0.00%

0.00%

0.00%

0.00%

0.00%

0.00%

0.00%

C

0.00%

0.00%

0.00%

0.00%

0.00%

0.00%

0.00%

0.00%

0.00%

0.00%

D

0.00%

0.00%

0.00%

0.00%

0.00%

0.00%

0.00%

0.00%

0.00%

100.00%